October 9: Hang Seng Index rises 1.79%, two U.S. indexes gain, Shanghai Composite edges up
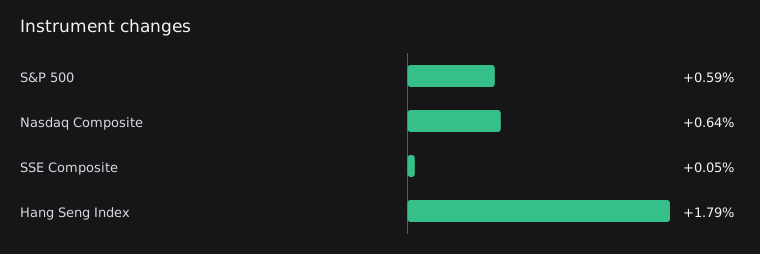
On October 9, the latest complete trading day for each index, the Hang Seng Index rose 1.79%, the S&P 500 gained 0.59%, the Nasdaq Composite rose 0.64%, and the Shanghai Composite gained 0.05%. All four indexes moved in the same direction, but their closing comparison windows did not fully coincide. Cryptocurrency data is insufficient in this edition, so it cannot establish whether stocks and cryptocurrencies moved in sync.

Hang Seng Index gains more than Shanghai Composite
Comparing the October 8 and October 9 closes, the Hang Seng Index rose 1.79%, while the Shanghai Composite gained 0.05%. Both indexes rose in this edition, with the Hang Seng Index posting the larger gain. This comparison covers only these two indexes and cannot represent the performance of all sectors in Hong Kong stocks and mainland A-shares.
Both U.S. indexes rise
On October 9, the latest complete trading day, the S&P 500 rose 0.59% from its October 8 close, and the Nasdaq Composite gained 0.64%. Both indexes use the same closing comparison window, with the Nasdaq Composite posting a slightly larger gain. This edition's data does not provide constituent contributions, so it cannot establish which companies drove the gains.
Same trading dates, different closing windows
All four indexes compare the October 8 and October 9 closes. In UTC, however, the Shanghai Composite's window runs from 07:00 on October 8 to 07:00 on October 9, the Hang Seng Index's from 08:00 to 08:00, and both U.S. indexes' from 20:00 to 20:00. This edition can therefore confirm that all four indexes rose within their respective windows. It cannot yet describe these moves as synchronized reactions over the same period, nor can common drivers be inferred solely from their shared direction.
Related news and discussion
Federal Reserve Board releases results of the 2025 Survey of Consumer Finances, which provides the public and policymakers with detailed insights into the economic condition of American families
The summary of an official Federal Reserve announcement states that the results of the 2025 Survey of Consumer Finances have been released, providing the public and policymakers with information on the economic condition of American families. The summary gives no specific survey figures, so this edition draws no conclusions from it about changes in household finances or market effects.
What to watch next
- In subsequent complete trading days, watch whether the Hang Seng Index continues to gain more than the Shanghai Composite, and whether the two U.S. indexes continue to move in the same direction.
- Once valid closing comparisons for the CSI 300 and Hang Seng Tech Index are available, observe whether their directions match those of the corresponding market indexes in this edition.
- Once updated Bitcoin and Ethereum data with clearly defined windows is available, compare their directions of movement with those of the stock indexes.
- If the full text of the Survey of Consumer Finances is included in a later edition, verify the specific survey results before discussing their implications.
Market data
Market cutoff: 2026-10-10T00:00:00Z
| Instrument | Price | Change | Session / window end | Source | Quality |
|---|---|---|---|---|---|
| S&P 500^GSPC | 7811.5400390625Previous: 7765.35986328125 | +0.59% | 2026-10-092026-10-08T20:00:00Z → 2026-10-09T20:00:00ZWindow: exchange_close_to_closeProvider time: 2026-10-09T13:30:00ZCollected: 2026-10-10T03:06:40Z | Yahoo Finance chart | Available |
| Nasdaq Composite^IXIC | 27366.169921875Previous: 27193.33984375 | +0.64% | 2026-10-092026-10-08T20:00:00Z → 2026-10-09T20:00:00ZWindow: exchange_close_to_closeProvider time: 2026-10-09T13:30:00ZCollected: 2026-10-10T03:06:40Z | Yahoo Finance chart | Available |
| SSE Composite000001.SS | 3813.791015625Previous: 3811.904052734375 | +0.05% | 2026-10-092026-10-08T07:00:00Z → 2026-10-09T07:00:00ZWindow: exchange_close_to_closeProvider time: 2026-10-09T01:30:00ZCollected: 2026-10-10T03:06:40Z | Yahoo Finance chart | Available |
| CSI 300000300.SS | — | — | Not providedCollected: 2026-10-10T03:06:40Z | Yahoo Finance chart | No reliable data |
| Hang Seng Index^HSI | 24211.349609375Previous: 23785.7890625 | +1.79% | 2026-10-092026-10-08T08:00:00Z → 2026-10-09T08:00:00ZWindow: exchange_close_to_closeProvider time: 2026-10-09T01:30:00ZCollected: 2026-10-10T03:06:40Z | Yahoo Finance chart | Available |
| Hang Seng Tech Index^HSTECH | — | — | Not providedCollected: 2026-10-10T03:06:40Z | Yahoo Finance chart | No reliable data |
| BitcoinBTC | 81676.3359375Previous: 83275.9296875 | -1.92% | 2026-10-082026-10-08T00:00:00Z → 2026-10-09T00:00:00ZWindow: utc_calendar_day_24hProvider time: 2026-10-08T00:00:00ZCollected: 2026-10-10T03:06:40Z | Yahoo Finance chart | Stale |
| EthereumETH | 2471.91259765625Previous: 2573.52734375 | -3.95% | 2026-10-082026-10-08T00:00:00Z → 2026-10-09T00:00:00ZWindow: utc_calendar_day_24hProvider time: 2026-10-08T00:00:00ZCollected: 2026-10-10T03:06:40Z | Yahoo Finance chart | Stale |
Sources and method
Stocks use their latest complete sessions; crypto assets have explicit measurement windows. Dates are listed in the table. Interpretations are separated from observed facts and can be checked against the original sources below. Read the measurement policy.
- S&P 500 — Yahoo Finance chart
- 纳斯达克综合指数 — Yahoo Finance chart
- 上证指数 — Yahoo Finance chart
- 恒生指数 — Yahoo Finance chart
- Federal Reserve Board releases results of the 2025 Survey of Consumer Finances, which provides the public and policymakers with detailed insights into the economic condition of American families
For information only, not investment advice. Read all daily observations