Hang Seng rises 1.79% on October 9, two U.S. indexes gain about 0.6%, Shanghai edges higher
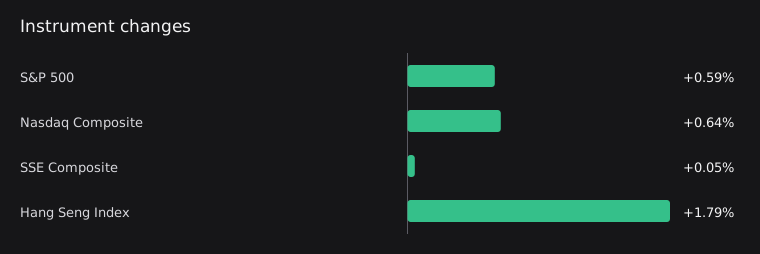
All four stock indexes with available data for this edition closed higher on October 9: the Hang Seng Index rose 1.79%, the S&P 500 gained 0.59%, the Nasdaq Composite gained 0.64%, and the Shanghai Composite rose 0.05%. Each comparison uses the October 8 and October 9 closes, but the markets close at different times, so these figures cannot establish synchronized movements. Cryptocurrency data is stale, data for the CSI 300 and Hang Seng TECH Index is missing, and no official announcement summaries were available for inclusion in this edition.

Hang Seng posts a larger gain, while Shanghai closes nearly flat
On October 9, the latest completed trading day for each market, the Hang Seng Index rose 1.79% from its October 8 close, while the Shanghai Composite gained 0.05%. The Hang Seng's gain was larger, but these two indexes cannot represent the performance of all sectors in Hong Kong equities and A-shares.
Both U.S. indexes rise
On October 9, the S&P 500 rose 0.59% from its October 8 close, while the Nasdaq Composite gained 0.64%. The two indexes moved in the same direction with similar gains. This edition's data can confirm only changes at the index level; it cannot establish the contributions of specific sectors or individual stocks.
Trading dates match, but measurement windows do not fully overlap
All four stock indexes use close-to-close comparisons from October 8 to October 9. In UTC, the Shanghai Composite's measurement window ends at 07:00 on October 9, the Hang Seng's at 08:00, and both U.S. indexes' at 20:00. Closing higher on the same date, October 9, therefore does not mean they rose during the same period, nor is it sufficient to establish common drivers.
What to watch next
- Whether the difference in gains between the Hang Seng Index and Shanghai Composite persists on the next completed trading day.
- Whether the S&P 500 and Nasdaq Composite continue moving in the same direction on the next completed trading day.
- Once valid close-to-close comparisons are available for the CSI 300 and Hang Seng TECH Index, whether their movements align with those of the corresponding market indexes covered in this edition.
- Once updated data and clearly defined comparison windows are available for Bitcoin and Ethereum, observe how their direction of movement relates to that of stock indexes.
Market data
Market cutoff: 2026-10-11T00:00:00Z
| Instrument | Price | Change | Session / window end | Source | Quality |
|---|---|---|---|---|---|
| S&P 500^GSPC | 7811.5400390625Previous: 7765.35986328125 | +0.59% | 2026-10-092026-10-08T20:00:00Z → 2026-10-09T20:00:00ZWindow: exchange_close_to_closeProvider time: 2026-10-09T13:30:00ZCollected: 2026-10-11T02:58:37Z | Yahoo Finance chart | Available |
| Nasdaq Composite^IXIC | 27366.169921875Previous: 27193.33984375 | +0.64% | 2026-10-092026-10-08T20:00:00Z → 2026-10-09T20:00:00ZWindow: exchange_close_to_closeProvider time: 2026-10-09T13:30:00ZCollected: 2026-10-11T02:58:37Z | Yahoo Finance chart | Available |
| SSE Composite000001.SS | 3813.791015625Previous: 3811.904052734375 | +0.05% | 2026-10-092026-10-08T07:00:00Z → 2026-10-09T07:00:00ZWindow: exchange_close_to_closeProvider time: 2026-10-09T01:30:00ZCollected: 2026-10-11T02:58:37Z | Yahoo Finance chart | Available |
| CSI 300000300.SS | — | — | Not providedCollected: 2026-10-11T02:58:37Z | Yahoo Finance chart | No reliable data |
| Hang Seng Index^HSI | 24211.349609375Previous: 23785.7890625 | +1.79% | 2026-10-092026-10-08T08:00:00Z → 2026-10-09T08:00:00ZWindow: exchange_close_to_closeProvider time: 2026-10-09T01:30:00ZCollected: 2026-10-11T02:58:37Z | Yahoo Finance chart | Available |
| Hang Seng Tech Index^HSTECH | — | — | Not providedCollected: 2026-10-11T02:58:37Z | Yahoo Finance chart | No reliable data |
| BitcoinBTC | 82546.3203125Previous: 81676.3359375 | +1.07% | 2026-10-092026-10-09T00:00:00Z → 2026-10-10T00:00:00ZWindow: utc_calendar_day_24hProvider time: 2026-10-09T00:00:00ZCollected: 2026-10-11T02:58:37Z | Yahoo Finance chart | Stale |
| EthereumETH | 2485.53857421875Previous: 2471.91259765625 | +0.55% | 2026-10-092026-10-09T00:00:00Z → 2026-10-10T00:00:00ZWindow: utc_calendar_day_24hProvider time: 2026-10-09T00:00:00ZCollected: 2026-10-11T02:58:37Z | Yahoo Finance chart | Stale |
Sources and method
Stocks use their latest complete sessions; crypto assets have explicit measurement windows. Dates are listed in the table. Interpretations are separated from observed facts and can be checked against the original sources below. Read the measurement policy.
For information only, not investment advice. Read all daily observations