October 13 Close: Hang Seng and Shanghai Composite Edge Up, S&P 500 and Nasdaq Slip
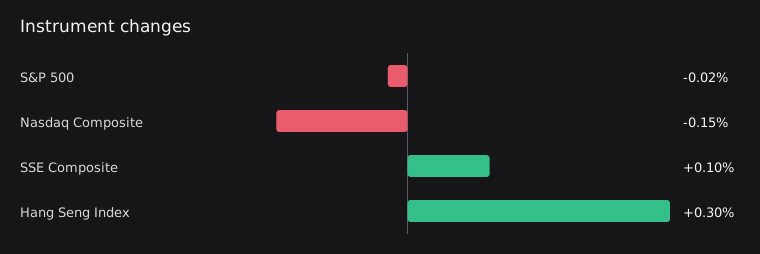
On October 13, the Hang Seng Index rose 0.31% and the Shanghai Composite Index gained 0.10%; the S&P 500 fell 0.02% and the Nasdaq Composite declined 0.15%. These changes compare each index's October 12 and October 13 closes, but closing times differ, so they cannot be treated as simultaneous reactions over the same period. Cryptocurrency data was stale and excluded from this edition's comparison of gains and losses.

Both U.S. Indices Fall, with a Larger Decline in the Nasdaq
On October 13, the latest complete trading day, the S&P 500 fell 0.02% from its October 12 close, while the Nasdaq Composite declined 0.15%. Both indices moved in the same direction, with the Nasdaq posting the larger decline; the performance of specific sectors or individual stocks cannot be determined from these two indices alone.
Hang Seng and Shanghai Composite Rise; Cross-Market Comparisons Must Account for Different Closing Times
Comparing the October 12 and October 13 closes, the Hang Seng Index rose 0.31% and the Shanghai Composite gained 0.10%, moving in the opposite direction to the two U.S. indices covered in this edition. Although the markets use the same trading dates, their closing times differ: the measurement windows for the Shanghai Composite, Hang Seng, and U.S. indices end at 07:00, 08:00, and 20:00 UTC on October 13, respectively. The data therefore confirms that the listed indices diverged, but it cannot establish that they reacted in opposite ways to the same event.
NVIDIA Announcement Provides Product Information but Cannot Yet Explain Index Moves
The summary of NVIDIA's official announcement describes RTX Spark as combining gaming, content creation, and personal AI computing capabilities, and lists up to 128GB of unified memory and 1 petaflop of AI computing performance. These are the publisher's descriptions of the product. This edition has no market data for NVIDIA shares or related sectors, so this information cannot explain the Nasdaq Composite's decline.
Related news and discussion
Minutes of the Board's discount rate meetings on August 17, September 9, and September 16, 2026
The summary of the Federal Reserve's official announcement lists minutes of the discount rate meetings held on August 17, September 9, and September 16, 2026, without details of the discussions or decisions.
All Systems Go: Global PC App Ecosystem Ready for NVIDIA RTX Spark
The summary of NVIDIA's official announcement describes RTX Spark's uses for gaming, content creation, and personal AI computing, and states that it offers up to 128GB of unified memory and 1 petaflop of AI computing performance.
From Earth to Orbit, France’s Ecosystem Delivers Agentic Computing at Scale With NVIDIA
The summary of NVIDIA's official announcement states that French companies are deploying agentic computing in the space sector, financial services, the public sector, and scientific research; the excerpt provides no specific project outcomes.
What to watch next
- Whether the Hang Seng and Shanghai Composite continue to move in the opposite direction to the two U.S. indices on the next complete trading day.
- Whether the Nasdaq Composite's decline remains larger than the S&P 500's on the next complete trading day.
- Once valid closing data is available for the CSI 300 and Hang Seng Tech Index, whether each moves in the same direction as the index already included for its respective market.
- Once valid comparison windows are updated for Bitcoin and Ethereum, review their gains and losses and clearly identify how those windows differ from the stock market closing periods.
Market data
Market cutoff: 2026-10-14T00:00:00Z
| Instrument | Price | Change | Session / window end | Source | Quality |
|---|---|---|---|---|---|
| S&P 500^GSPC | 7805.4501953125Previous: 7807.240234375 | -0.02% | 2026-10-132026-10-12T20:00:00Z → 2026-10-13T20:00:00ZWindow: exchange_close_to_closeProvider time: 2026-10-13T13:30:00ZCollected: 2026-10-14T03:05:37Z | Yahoo Finance chart | Available |
| Nasdaq Composite^IXIC | 27204.380859375Previous: 27245.900390625 | -0.15% | 2026-10-132026-10-12T20:00:00Z → 2026-10-13T20:00:00ZWindow: exchange_close_to_closeProvider time: 2026-10-13T13:30:00ZCollected: 2026-10-14T03:05:37Z | Yahoo Finance chart | Available |
| SSE Composite000001.SS | 3800.864990234375Previous: 3797.241943359375 | +0.10% | 2026-10-132026-10-12T07:00:00Z → 2026-10-13T07:00:00ZWindow: exchange_close_to_closeProvider time: 2026-10-13T01:30:00ZCollected: 2026-10-14T03:05:37Z | Yahoo Finance chart | Available |
| CSI 300000300.SS | — | — | Not providedCollected: 2026-10-14T03:05:37Z | Yahoo Finance chart | No reliable data |
| Hang Seng Index^HSI | 24345.220703125Previous: 24271.19921875 | +0.30% | 2026-10-132026-10-12T08:00:00Z → 2026-10-13T08:00:00ZWindow: exchange_close_to_closeProvider time: 2026-10-13T01:30:00ZCollected: 2026-10-14T03:05:37Z | Yahoo Finance chart | Available |
| Hang Seng Tech Index^HSTECH | — | — | Not providedCollected: 2026-10-14T03:05:37Z | Yahoo Finance chart | No reliable data |
| BitcoinBTC | 81762.5625Previous: 83679.46875 | -2.29% | 2026-10-122026-10-12T00:00:00Z → 2026-10-13T00:00:00ZWindow: utc_calendar_day_24hProvider time: 2026-10-12T00:00:00ZCollected: 2026-10-14T03:05:37Z | Yahoo Finance chart | Stale |
| EthereumETH | 2444.357421875Previous: 2534.69921875 | -3.56% | 2026-10-122026-10-12T00:00:00Z → 2026-10-13T00:00:00ZWindow: utc_calendar_day_24hProvider time: 2026-10-12T00:00:00ZCollected: 2026-10-14T03:05:37Z | Yahoo Finance chart | Stale |
Sources and method
Stocks use their latest complete sessions; crypto assets have explicit measurement windows. Dates are listed in the table. Interpretations are separated from observed facts and can be checked against the original sources below. Read the measurement policy.
- S&P 500 — Yahoo Finance chart
- 纳斯达克综合指数 — Yahoo Finance chart
- 上证指数 — Yahoo Finance chart
- 恒生指数 — Yahoo Finance chart
- Minutes of the Board's discount rate meetings on August 17, September 9, and September 16, 2026
- All Systems Go: Global PC App Ecosystem Ready for NVIDIA RTX Spark
- From Earth to Orbit, France’s Ecosystem Delivers Agentic Computing at Scale With NVIDIA
For information only, not investment advice. Read all daily observations