Nasdaq Falls 1.88%, Shanghai Composite and Hang Seng Also Close Lower on the Same Date: Comparison Windows Differ
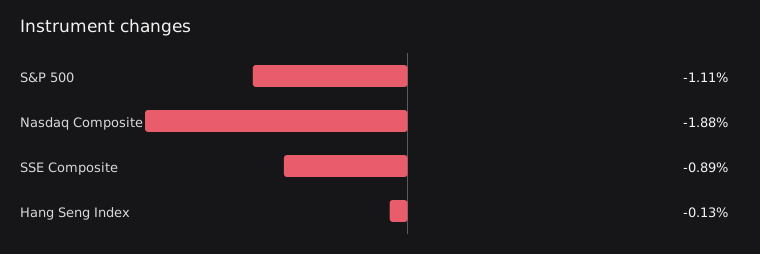
On October 14, the latest completed trading day, the Nasdaq Composite fell 1.88%, the S&P 500 fell 1.11%, the Shanghai Composite fell 0.89%, and the Hang Seng Index fell 0.13%. These indices share the same trading date, but their close-to-close comparison windows differ, so simultaneous declines or a common cause cannot be inferred from these figures. Valid market data for the CSI 300, Hang Seng TECH Index, and cryptocurrencies is insufficient.

Both US Indices Close Lower, with a Larger Decline in the Nasdaq
On October 14, the Nasdaq Composite fell 1.88% from its October 13 close, while the S&P 500 fell 1.11%. Both indices use the same close-to-close comparison window, from October 13 at 20:00 UTC to October 14 at 20:00 UTC. The data in this edition supports the observation that the Nasdaq fell more, but provides no sector or individual stock contributions, so the constituents driving the declines cannot be determined.
Shanghai Composite and Hang Seng Both Close Lower, with a Smaller Decline in the Hang Seng
On October 14, the Shanghai Composite fell 0.89% from the previous trading day, while the Hang Seng Index fell 0.13%. The Shanghai Composite's close-to-close comparison window runs from October 13 at 07:00 UTC to October 14 at 07:00 UTC, and the Hang Seng's runs from October 13 at 08:00 UTC to October 14 at 08:00 UTC. Both windows end before this edition's US equity comparison window ends, so these declines can only be compared within their respective trading sessions and cannot be directly interpreted as market reactions at the same moment.
No Direct Causal Link Can Be Established Between NVIDIA's Application Announcement and the Index Decline
The summary of NVIDIA's official announcement says semiconductor companies are adopting CUDA-X libraries, including the newly introduced cuPotential, to advance AI-defined fabs. cuPotential can be used to build AI agents that simulate atomic and molecular interactions. This provides specific information about technology applications, but this edition lacks individual stock data for NVIDIA and related companies, so the available information does not establish an explanation for the Nasdaq's decline that day.
Related news and discussion
NVIDIA and Semiconductor Leaders Advance AI Across Chip Design and Manufacturing for AI-Defined Fabs
The official announcement summary says semiconductor companies are adopting NVIDIA CUDA-X libraries to advance AI-defined fabs; cuPotential can help developers build AI agents that simulate atomic and molecular interactions.
HKEX’s Core Climate Completes First Cross-boundary Pilots in Green Electricity Certificates and Carbon Allowances
The official announcement summary says Hong Kong Exchanges and Clearing's Core Climate has completed its first cross-border pilots involving green electricity certificates and carbon allowances. The summary provides no details on transaction volumes or participants.
NVIDIA Commits $250 Million to Advance UK Agentic Safety and Security Research Over the Next Five Years
The official announcement summary says NVIDIA announced a donation of $250 million worth of computing resources over the next five years to strengthen the UK's research capabilities in agentic safety and security.
What to watch next
- Whether the Nasdaq Composite's decline remains larger than the S&P 500's on the next completed trading day.
- Whether the Shanghai Composite and Hang Seng Index continue moving in the same direction within their respective subsequent close-to-close windows.
- Once valid market data resumes for the CSI 300 and Hang Seng TECH Index, whether they move in the same direction as the indices already covered in their respective markets.
- Once updated comparison windows meeting data quality requirements are available for Bitcoin and Ethereum, examine how their direction differs from that of equities.
Market data
Market cutoff: 2026-10-15T00:00:00Z
| Instrument | Price | Change | Session / window end | Source | Quality |
|---|---|---|---|---|---|
| S&P 500^GSPC | 7718.93994140625Previous: 7805.4501953125 | -1.11% | 2026-10-142026-10-13T20:00:00Z → 2026-10-14T20:00:00ZWindow: exchange_close_to_closeProvider time: 2026-10-14T13:30:00ZCollected: 2026-10-15T03:37:21Z | Yahoo Finance chart | Available |
| Nasdaq Composite^IXIC | 26692.869140625Previous: 27204.380859375 | -1.88% | 2026-10-142026-10-13T20:00:00Z → 2026-10-14T20:00:00ZWindow: exchange_close_to_closeProvider time: 2026-10-14T13:30:00ZCollected: 2026-10-15T03:37:21Z | Yahoo Finance chart | Available |
| SSE Composite000001.SS | 3767.22705078125Previous: 3800.864990234375 | -0.89% | 2026-10-142026-10-13T07:00:00Z → 2026-10-14T07:00:00ZWindow: exchange_close_to_closeProvider time: 2026-10-14T01:30:00ZCollected: 2026-10-15T03:37:21Z | Yahoo Finance chart | Available |
| CSI 300000300.SS | — | — | Not providedCollected: 2026-10-15T03:37:21Z | Yahoo Finance chart | No reliable data |
| Hang Seng Index^HSI | 24314.169921875Previous: 24345.220703125 | -0.13% | 2026-10-142026-10-13T08:00:00Z → 2026-10-14T08:00:00ZWindow: exchange_close_to_closeProvider time: 2026-10-14T01:30:00ZCollected: 2026-10-15T03:37:21Z | Yahoo Finance chart | Available |
| Hang Seng Tech Index^HSTECH | — | — | Not providedCollected: 2026-10-15T03:37:21Z | Yahoo Finance chart | No reliable data |
| BitcoinBTC | 83095.125Previous: 81762.5625 | +1.63% | 2026-10-132026-10-13T00:00:00Z → 2026-10-14T00:00:00ZWindow: utc_calendar_day_24hProvider time: 2026-10-13T00:00:00ZCollected: 2026-10-15T03:37:21Z | Yahoo Finance chart | Stale |
| EthereumETH | 2496.62548828125Previous: 2444.357421875 | +2.14% | 2026-10-132026-10-13T00:00:00Z → 2026-10-14T00:00:00ZWindow: utc_calendar_day_24hProvider time: 2026-10-13T00:00:00ZCollected: 2026-10-15T03:37:21Z | Yahoo Finance chart | Stale |
Sources and method
Stocks use their latest complete sessions; crypto assets have explicit measurement windows. Dates are listed in the table. Interpretations are separated from observed facts and can be checked against the original sources below. Read the measurement policy.
- S&P 500 — Yahoo Finance chart
- 纳斯达克综合指数 — Yahoo Finance chart
- 上证指数 — Yahoo Finance chart
- 恒生指数 — Yahoo Finance chart
- NVIDIA and Semiconductor Leaders Advance AI Across Chip Design and Manufacturing for AI-Defined Fabs
- HKEX’s Core Climate Completes First Cross-boundary Pilots in Green Electricity Certificates and Carbon Allowances
- NVIDIA Commits $250 Million to Advance UK Agentic Safety and Security Research Over the Next Five Years
For information only, not investment advice. Read all daily observations