S&P 500 edges up, Nasdaq slips slightly; Hang Seng decline spans a longer comparison window
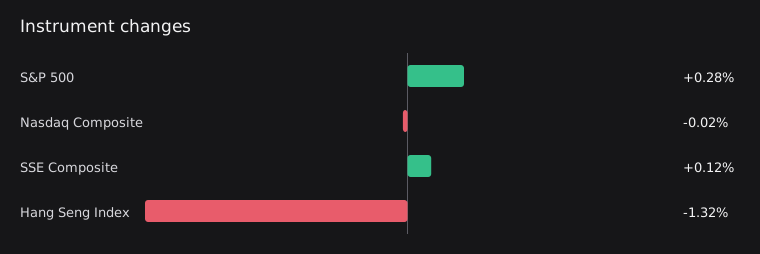
On October 20, the S&P 500 rose 0.28% from the previous trading day, the Nasdaq Composite fell 0.02%, and the Shanghai Composite rose 0.12%. The Hang Seng Index fell 1.32% from October 16, a different comparison window that cannot directly be treated as cross-market divergence on the same day. Cryptocurrency data is stale and is excluded from this edition's comparison of gains and losses.

The two US indexes move in opposite directions, both by small margins
For the complete trading day on October 20, the S&P 500 rose 0.28% from the October 19 close, while the Nasdaq Composite fell 0.02%. Both indexes use the same closing-price comparison window. This edition's data shows one rising and the other falling; it cannot support a characterization of broad gains in US stocks.
Shanghai's gain and the Hang Seng's decline use different windows
The Shanghai Composite rose 0.12% on October 20 from the October 19 close. The Hang Seng Index fell 1.32% when comparing October 16 and October 20, the two consecutive available closing records. Their directions differ, but their comparison windows do not match. These gains and losses cannot directly be interpreted as differences in market strength on the same trading day.
HKEX announcement offers a new development to watch in green equity financing
The summary of an official Hong Kong Exchanges and Clearing announcement indicates that HKEX launched the Green Equity Designation Programme to strengthen capital support for the green economy. The summary provides no implementation details or market reaction, so it is insufficient to determine whether the programme is connected to the Hang Seng Index's decline over this edition's comparison period.
Sources: [5]
Related news and discussion
HKEX Launches Green Equity Designation Programme to Strengthen Capital Support for Green Economy
The summary of an official Hong Kong Exchanges and Clearing announcement states that HKEX launched the Green Equity Designation Programme to strengthen capital support for the green economy.
Spain-Based Startups Advance Regional Innovation With Barcelona Supercomputing Center
The summary of an official NVIDIA announcement says that the Barcelona Supercomputing Center's AI Factory Accelerator Programme is fully operational following its pilot, providing startups with sovereign computing resources, technical support and training.
What to watch next
- Whether the S&P 500 and Nasdaq Composite continue to move in opposite directions over subsequent complete trading days.
- Once closing-price comparisons with matching start and end dates are available for the Shanghai Composite and Hang Seng Index, observe whether their directions still differ.
- Whether subsequent announcements about HKEX's Green Equity Designation Programme disclose designation criteria, scope and participation.
- Whether valid updates become available for the CSI 300, Hang Seng TECH Index, Bitcoin and Ethereum that can be used for this edition's comparison.
Market data
Market cutoff: 2026-10-21T00:00:00Z
| Instrument | Price | Change | Session / window end | Source | Quality |
|---|---|---|---|---|---|
| S&P 500^GSPC | 7712.56982421875Previous: 7690.72998046875 | +0.28% | 2026-10-202026-10-19T20:00:00Z → 2026-10-20T20:00:00ZWindow: exchange_close_to_closeProvider time: 2026-10-20T13:30:00ZCollected: 2026-10-21T03:05:06Z | Yahoo Finance chart | Available |
| Nasdaq Composite^IXIC | 26424.81640625Previous: 26430.890625 | -0.02% | 2026-10-202026-10-19T20:00:00Z → 2026-10-20T20:00:00ZWindow: exchange_close_to_closeProvider time: 2026-10-20T13:30:00ZCollected: 2026-10-21T03:05:06Z | Yahoo Finance chart | Available |
| SSE Composite000001.SS | 3735.3701171875Previous: 3730.919921875 | +0.12% | 2026-10-202026-10-19T07:00:00Z → 2026-10-20T07:00:00ZWindow: exchange_close_to_closeProvider time: 2026-10-20T01:30:00ZCollected: 2026-10-21T03:05:06Z | Yahoo Finance chart | Available |
| CSI 300000300.SS | — | — | Not providedCollected: 2026-10-21T03:05:06Z | Yahoo Finance chart | No reliable data |
| Hang Seng Index^HSI | 23867.740234375Previous: 24186.830078125 | -1.32% | 2026-10-202026-10-16T08:00:00Z → 2026-10-20T08:00:00ZWindow: exchange_close_to_closeProvider time: 2026-10-20T01:30:00ZCollected: 2026-10-21T03:05:06Z | Yahoo Finance chart | Available |
| Hang Seng Tech Index^HSTECH | — | — | Not providedCollected: 2026-10-21T03:05:06Z | Yahoo Finance chart | No reliable data |
| BitcoinBTC | 81853.5390625Previous: 82017.6015625 | -0.20% | 2026-10-192026-10-19T00:00:00Z → 2026-10-20T00:00:00ZWindow: utc_calendar_day_24hProvider time: 2026-10-19T00:00:00ZCollected: 2026-10-21T03:05:06Z | Yahoo Finance chart | Stale |
| EthereumETH | 2404.815185546875Previous: 2408.741455078125 | -0.16% | 2026-10-192026-10-19T00:00:00Z → 2026-10-20T00:00:00ZWindow: utc_calendar_day_24hProvider time: 2026-10-19T00:00:00ZCollected: 2026-10-21T03:05:06Z | Yahoo Finance chart | Stale |
Sources and method
Stocks use their latest complete sessions; crypto assets have explicit measurement windows. Dates are listed in the table. Interpretations are separated from observed facts and can be checked against the original sources below. Read the measurement policy.
For information only, not investment advice. Read all daily observations