Nasdaq Falls 5.52%, Hang Seng Rises 3.67%: November 5 Closing Moves Diverge
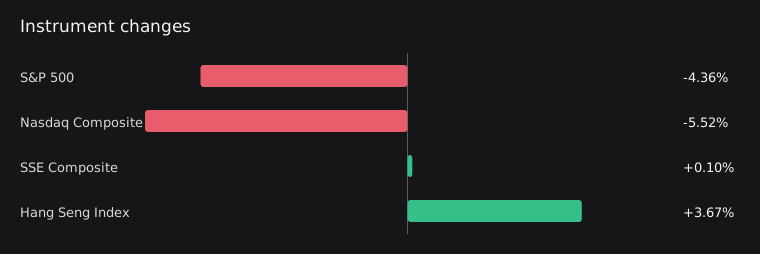
On November 5, the S&P 500 fell 4.36% and the Nasdaq Composite fell 5.52%; the Hang Seng Index rose 3.67% and the Shanghai Composite rose 0.10%. All changes compare the November 4 and November 5 closes, but the markets closed at different times, so these moves cannot establish that money shifted between markets. Cryptocurrency data is stale, so this edition makes no comparison of cryptocurrency gains or losses.

Both U.S. Indexes Fall, with a Larger Decline in the Nasdaq
On November 5, the latest completed trading day, the S&P 500 fell 4.36% from its November 4 close, while the Nasdaq Composite fell 5.52%. Both indexes use the same closing-price comparison window, confirming that the Nasdaq declined more over this window; this edition's data is insufficient to determine the contributions of specific sectors or constituent stocks.
Hang Seng and Shanghai Composite Rise by Different Amounts
On November 5, the Hang Seng Index rose 3.67% from its November 4 close, while the Shanghai Composite rose 0.10%. Both indexes closed higher, with the Hang Seng posting the larger gain. This observation covers only the listed indexes and cannot be extended to the performance of Hong Kong's technology sector or the A-share market as a whole.
The Same Trading Date, but Different Measurement Windows
All stock index comparisons in this edition use the November 4 and November 5 closes, but their measurement windows end at different times: November 5 at 15:00 for the Shanghai Composite, November 5 at 16:00 for the Hang Seng Index, and November 6 at 05:00 for both U.S. indexes, all in Singapore time. Asian markets closed before U.S. markets. Their opposite directions show only that performance differed within their respective windows; they do not establish synchronized reactions or cross-market fund flows.
Related news and discussion
Vera Delivers the Best of Both Worlds: Highest Throughput and Fastest Agents
The summary of NVIDIA's official announcement describes how AI agents rely on CPUs for steps such as search, database queries, and writing and testing code, switching between GPU inference and CPU execution. The excerpt provides no verifiable comparative performance data.
More Performance From Every Byte: How Full-Stack Codesign Solves AI’s Memory Challenge
The summary of NVIDIA's official announcement says that larger models, longer contexts and agent applications are increasing pressure on GPU memory, while memory supply is tightening and prices are rising. These are the publisher's statements in the excerpt and cannot be used to explain the stock index moves in this edition.
Federal Reserve Board announces termination of enforcement action with Allegiant United Holdings, LLC, Nano Financial Holdings, Inc., and Nano Banc
The summary of the Federal Reserve's official announcement states that it has terminated enforcement action involving Allegiant United Holdings, LLC, Nano Financial Holdings, Inc. and Nano Banc. The excerpt does not specify the reasons or conditions.
What to watch next
- Whether the Nasdaq Composite's decline remains larger than the S&P 500's on the next completed trading day.
- Whether the Hang Seng Index and Shanghai Composite continue to move in the same direction on the next completed trading day, and whether their divergence in direction from U.S. stocks persists.
- Whether valid closing records for the CSI 300 and Hang Seng TECH Index, once available, support the differences currently observed between indexes.
- Once Bitcoin and Ethereum data is updated, first check the comparison windows, then assess whether their performance can be considered alongside stock market performance.
Market data
Market cutoff: 2026-11-06T00:00:00Z
| Instrument | Price | Change | Session / window end | Source | Quality |
|---|---|---|---|---|---|
| S&P 500^GSPC | 7353.72998046875Previous: 7688.6201171875 | -4.36% | 2026-11-052026-11-04T21:00:00Z → 2026-11-05T21:00:00ZWindow: exchange_close_to_closeProvider time: 2026-11-05T14:30:00ZCollected: 2026-11-06T03:07:56Z | Yahoo Finance chart | Available |
| Nasdaq Composite^IXIC | 24314.998046875Previous: 25736.509765625 | -5.52% | 2026-11-052026-11-04T21:00:00Z → 2026-11-05T21:00:00ZWindow: exchange_close_to_closeProvider time: 2026-11-05T14:30:00ZCollected: 2026-11-06T03:07:56Z | Yahoo Finance chart | Available |
| SSE Composite000001.SS | 3689.910888671875Previous: 3686.173095703125 | +0.10% | 2026-11-052026-11-04T07:00:00Z → 2026-11-05T07:00:00ZWindow: exchange_close_to_closeProvider time: 2026-11-05T01:30:00ZCollected: 2026-11-06T03:07:56Z | Yahoo Finance chart | Available |
| CSI 300000300.SS | — | — | Not providedCollected: 2026-11-06T03:07:56Z | Yahoo Finance chart | No reliable data |
| Hang Seng Index^HSI | 24796.98046875Previous: 23919.5 | +3.67% | 2026-11-052026-11-04T08:00:00Z → 2026-11-05T08:00:00ZWindow: exchange_close_to_closeProvider time: 2026-11-05T01:30:00ZCollected: 2026-11-06T03:07:56Z | Yahoo Finance chart | Available |
| Hang Seng Tech Index^HSTECH | — | — | Not providedCollected: 2026-11-06T03:07:56Z | Yahoo Finance chart | No reliable data |
| BitcoinBTC | 80405.2890625Previous: 77345.046875 | +3.96% | 2026-11-042026-11-04T00:00:00Z → 2026-11-05T00:00:00ZWindow: utc_calendar_day_24hProvider time: 2026-11-04T00:00:00ZCollected: 2026-11-06T03:07:56Z | Yahoo Finance chart | Stale |
| EthereumETH | 2422.311767578125Previous: 2272.725830078125 | +6.58% | 2026-11-042026-11-04T00:00:00Z → 2026-11-05T00:00:00ZWindow: utc_calendar_day_24hProvider time: 2026-11-04T00:00:00ZCollected: 2026-11-06T03:07:56Z | Yahoo Finance chart | Stale |
Sources and method
Stocks use their latest complete sessions; crypto assets have explicit measurement windows. Dates are listed in the table. Interpretations are separated from observed facts and can be checked against the original sources below. Read the measurement policy.
- S&P 500 — Yahoo Finance chart
- 纳斯达克综合指数 — Yahoo Finance chart
- 上证指数 — Yahoo Finance chart
- 恒生指数 — Yahoo Finance chart
- Vera Delivers the Best of Both Worlds: Highest Throughput and Fastest Agents
- Federal Reserve Board announces termination of enforcement action with Allegiant United Holdings, LLC, Nano Financial Holdings, Inc., and Nano Banc
- More Performance From Every Byte: How Full-Stack Codesign Solves AI’s Memory Challenge
For information only, not investment advice. Read all daily observations