Two U.S. stock indexes close higher; Hang Seng falls over its comparison window
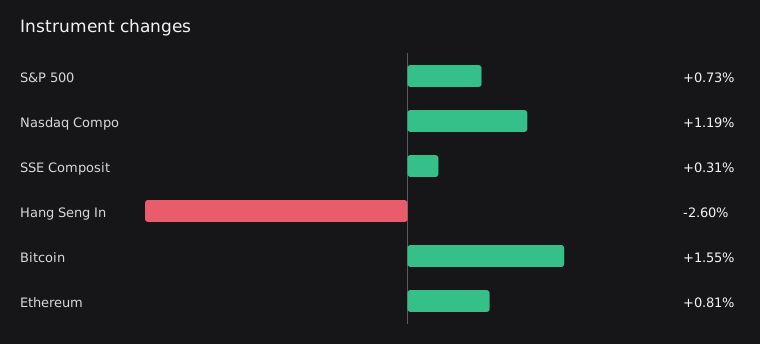
On October 2, the S&P 500 rose 0.73% and the Nasdaq Composite gained 1.19%; the Hang Seng Index fell 2.60% from its September 30 close. The Shanghai Composite's latest completed trading day was September 30, when it rose 0.31%. These changes cover different comparison windows. Cryptocurrency data is stale, and gaps remain in the cross-market picture.

Both U.S. indexes rise, with the Nasdaq posting the larger gain
For the completed trading day on October 2, the S&P 500 rose 0.73% from its October 1 close, while the Nasdaq Composite gained 1.19%. Both U.S. indexes included in this edition closed higher, with the Nasdaq posting the larger gain. These two indexes alone do not establish whether gains were broad-based across sectors.
Hang Seng falls, moving in the opposite direction to the two U.S. indexes
The Hang Seng Index fell 2.60% between September 30 and October 2, the two consecutive available closing records, while the two U.S. indexes rose between October 1 and October 2. The comparison windows begin on different dates. This observation establishes only a difference in direction within each market's window; it cannot confirm synchronized market movements or shifts in capital.
Shanghai Composite edges higher; latest observation remains September 30
The Shanghai Composite's latest completed trading day was September 30, when it rose 0.31% from its September 29 close. This result predates the latest trading day covered for the U.S. indexes and Hang Seng, so these results cannot be presented together as the performance of all three markets on October 2.
Sources: [3]
Related news and discussion
NVIDIA DGX Spark 64GB Gives Developers More Ways to Build and Scale Local AI
The summary of NVIDIA's official announcement says the DGX Spark with 64GB of unified memory will be available this month through manufacturing partners. The excerpt does not provide a specific release date.
Federal Reserve Board announces it will extend, until November 4, the comment period on its proposal to modernize Regulation O
The summary of the Federal Reserve's official announcement says the comment period on its proposal to modernize Regulation O will be extended to November 4. The excerpt does not describe the specific changes proposed.
What to watch next
- Whether the S&P 500 and Nasdaq Composite continue moving in the same direction on the next completed trading day, and whether the Nasdaq's gain remains larger.
- The direction of the Hang Seng Index's change between its next pair of consecutive closing records, and whether it matches the direction of U.S. indexes over the same period.
- Whether the Shanghai Composite's comparison window can be aligned with those of other markets once its next completed trading-day record is available.
- Whether differences in direction across markets persist once CSI 300 and Hang Seng Tech Index data and valid comparison windows for Bitcoin and Ethereum are available.
Market data
| Instrument | Price | Change | Session / window end | Source | Quality |
|---|---|---|---|---|---|
| S&P 500^GSPC | 7,722.7202 | +0.73% | 2026-10-02 | Yahoo Finance chart | Available |
| Nasdaq Composite^IXIC | 27,190.8633 | +1.19% | 2026-10-02 | Yahoo Finance chart | Available |
| SSE Composite000001.SS | 3,842.1951 | +0.31% | 2026-09-30 | Yahoo Finance chart | Available |
| CSI 300000300.SS | — | — | Not provided | Yahoo Finance chart | No reliable data |
| Hang Seng Index^HSI | 23,972.2891 | -2.60% | 2026-10-02 | Yahoo Finance chart | Available |
| Hang Seng Tech Index^HSTECH | — | — | Not provided | Yahoo Finance chart | No reliable data |
| BitcoinBTC | 84,853.1016 | +1.55% | 2026-10-01 | Yahoo Finance chart | Stale |
| EthereumETH | 2,705.5371 | +0.81% | 2026-10-01 | Yahoo Finance chart | Stale |
Sources and method
Stocks use their latest complete sessions; crypto assets have explicit measurement windows. Dates are listed in the table. Interpretations are separated from observed facts and can be checked against the original sources below. Read the measurement policy.
- S&P 500 — Yahoo Finance chart
- 纳斯达克综合指数 — Yahoo Finance chart
- 上证指数 — Yahoo Finance chart
- 恒生指数 — Yahoo Finance chart
- Federal Reserve Board announces it will extend, until November 4, the comment period on its proposal to modernize Regulation O
- NVIDIA DGX Spark 64GB Gives Developers More Ways to Build and Scale Local AI
For information only, not investment advice. Read all daily observations