Two U.S. indexes outgain the Hang Seng; A-share observations remain at September 30
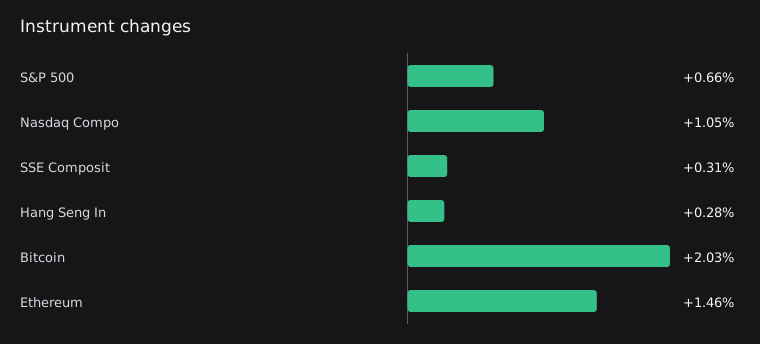
On October 5, the Nasdaq Composite rose 1.05%, the S&P 500 rose 0.66%, and the Hang Seng Index rose 0.28%, all compared with their October 2 closes. The Shanghai Composite's latest full trading day was September 30, when it rose 0.31%. This edition lacks CSI 300 and Hang Seng Tech Index data and usable cryptocurrency updates, leaving insufficient evidence to assess broader links across markets.

Both U.S. indexes rise, with the Nasdaq gaining more
On October 5, the latest full trading day, the Nasdaq Composite rose 1.05% and the S&P 500 rose 0.66%, both compared with their October 2 closes. The two indexes moved in the same direction, but index gains alone cannot establish whether the advance was broad-based among their constituent stocks.
The Hang Seng also rises, with a smaller gain than either U.S. index
The Hang Seng Index closed on October 5 up 0.28% from October 2, a smaller gain than the Nasdaq Composite and S&P 500 over the same period, based on each index's closing records. Markets close at different times, so this comparison shows only the direction and size of moves within their respective measurement windows. It does not establish that a common driver moved them in sync.
The Shanghai Composite observation is from an earlier date
The Shanghai Composite's latest full trading day was September 30, when it rose 0.31% from its September 29 close. This move covers an earlier measurement window and cannot be combined with the October 5 gains in U.S. and Hong Kong stocks as a single day's market performance.
Sources: [3]
Related news and discussion
Federal Reserve Board announces approval of application by Isabella Bank Corporation
The summary of the Federal Reserve's official announcement says the Board approved Isabella Bank Corporation's application. The summary does not specify the application details or the conditions of approval.
From Scan to Treatment Plan, AI Helps Close Breast Cancer’s Deadliest Gaps
The summary of NVIDIA's official announcement describes several challenges in breast cancer diagnosis and treatment: low screening participation, radiologists' image-reading workload, and test results used to guide treatment that may take weeks to return. The summary provides no data on the effectiveness of specific AI solutions.
What to watch next
- Whether the Nasdaq Composite and S&P 500 continue to move in the same direction on the next full trading day, and whether the Nasdaq's gain remains larger.
- Whether the Hang Seng Index moves in the same direction as the two U.S. indexes on the next full trading day.
- Once valid closing comparisons are available for the CSI 300 and Hang Seng Tech Index, check whether the two indexes within each market move in the same direction.
- Once Bitcoin and Ethereum updates are available, observe the direction of their moves over the same clearly defined comparison window.
Market data
| Instrument | Price | Change | Session / window end | Source | Quality |
|---|---|---|---|---|---|
| S&P 500^GSPC | 7,773.9502 | +0.66% | 2026-10-05 | Yahoo Finance chart | Available |
| Nasdaq Composite^IXIC | 27,477.3105 | +1.05% | 2026-10-05 | Yahoo Finance chart | Available |
| SSE Composite000001.SS | 3,842.1951 | +0.31% | 2026-09-30 | Yahoo Finance chart | Available |
| CSI 300000300.SS | — | — | Not provided | Yahoo Finance chart | No reliable data |
| Hang Seng Index^HSI | 24,040.3398 | +0.28% | 2026-10-05 | Yahoo Finance chart | Available |
| Hang Seng Tech Index^HSTECH | — | — | Not provided | Yahoo Finance chart | No reliable data |
| BitcoinBTC | 86,480.3047 | +2.03% | 2026-10-04 | Yahoo Finance chart | Stale |
| EthereumETH | 2,726.509 | +1.46% | 2026-10-04 | Yahoo Finance chart | Stale |
Sources and method
Stocks use their latest complete sessions; crypto assets have explicit measurement windows. Dates are listed in the table. Interpretations are separated from observed facts and can be checked against the original sources below. Read the measurement policy.
For information only, not investment advice. Read all daily observations