Nasdaq Falls 1.38%; Shanghai Composite and Hang Seng Also Close Lower on the Same Date
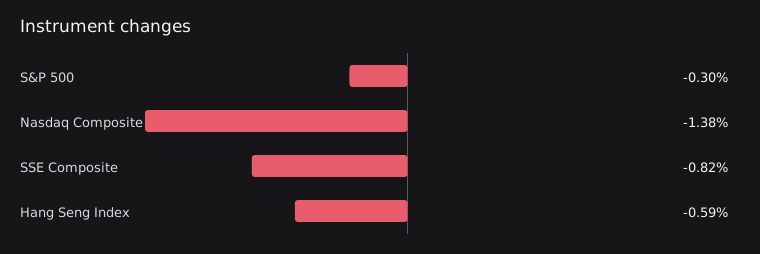
On October 29, the Nasdaq Composite fell 1.38%, the S&P 500 fell 0.30%, the Shanghai Composite fell 0.82%, and the Hang Seng Index fell 0.59%. Although the date was the same, each market's closing-price comparison window had different start and end times. Coverage is limited in this edition: valid market data for the CSI 300 and Hang Seng TECH Index are missing, and cryptocurrency data are stale.

U.S. Stocks: Nasdaq Falls More Than the S&P 500
On October 29, the latest complete trading day, the Nasdaq Composite fell 1.38% and the S&P 500 fell 0.30%. Both comparisons use closing records from October 28 and 29, with a measurement window from October 28 at 20:00 to October 29 at 20:00 UTC.
Shanghai Composite and Hang Seng Close Lower, Each Measured Over Its Own Closing-Price Window
On October 29, the latest complete trading day, the Shanghai Composite fell 0.82% and the Hang Seng Index fell 0.59%. The Shanghai Composite's closing-price comparison window ran from October 28 at 07:00 to October 29 at 07:00 UTC; the Hang Seng's ran from October 28 at 08:00 to October 29 at 08:00 UTC. Both had the same trading-day date as U.S. stocks, but each market's closing-price comparison window had different start and end times.
Related news and discussion
Federal Reserve Board announces approval of application by The Bank of Nova Scotia
The official announcement summary states that the Federal Reserve Board approved an application by The Bank of Nova Scotia; the summary did not provide details of the application.
Slice Into GFN Thursday: ‘Phantom Blade Zero’ Launches on GeForce NOW
NVIDIA's official announcement summary states that S-GAME's Phantom Blade Zero launched on GeForce NOW on October 29.
What to watch next
- Whether the Nasdaq Composite's decline remains larger than the S&P 500's on the next complete trading day.
- Whether valid closing-price comparison records can be obtained for the CSI 300 and Hang Seng TECH Index.
- Whether updated comparison-window data that meet quality requirements can be obtained for Bitcoin and Ethereum.
Market data
Market cutoff: 2026-10-30T00:00:00Z
| Instrument | Price | Change | Session / window end | Source | Quality |
|---|---|---|---|---|---|
| S&P 500^GSPC | 7720.39013671875Previous: 7743.97998046875 | -0.30% | 2026-10-292026-10-28T20:00:00Z → 2026-10-29T20:00:00ZWindow: exchange_close_to_closeProvider time: 2026-10-29T13:30:00ZCollected: 2026-10-30T03:02:34Z | Yahoo Finance chart | Available |
| Nasdaq Composite^IXIC | 26184.724609375Previous: 26549.849609375 | -1.38% | 2026-10-292026-10-28T20:00:00Z → 2026-10-29T20:00:00ZWindow: exchange_close_to_closeProvider time: 2026-10-29T13:30:00ZCollected: 2026-10-30T03:02:34Z | Yahoo Finance chart | Available |
| SSE Composite000001.SS | 3651.43408203125Previous: 3681.468994140625 | -0.82% | 2026-10-292026-10-28T07:00:00Z → 2026-10-29T07:00:00ZWindow: exchange_close_to_closeProvider time: 2026-10-29T01:30:00ZCollected: 2026-10-30T03:02:34Z | Yahoo Finance chart | Available |
| CSI 300000300.SS | — | — | Not providedCollected: 2026-10-30T03:02:34Z | Yahoo Finance chart | No reliable data |
| Hang Seng Index^HSI | 22958.650390625Previous: 23094.830078125 | -0.59% | 2026-10-292026-10-28T08:00:00Z → 2026-10-29T08:00:00ZWindow: exchange_close_to_closeProvider time: 2026-10-29T01:30:00ZCollected: 2026-10-30T03:02:34Z | Yahoo Finance chart | Available |
| Hang Seng Tech Index^HSTECH | — | — | Not providedCollected: 2026-10-30T03:02:34Z | Yahoo Finance chart | No reliable data |
| BitcoinBTC | 81267.5859375Previous: 80805.078125 | +0.57% | 2026-10-282026-10-28T00:00:00Z → 2026-10-29T00:00:00ZWindow: utc_calendar_day_24hProvider time: 2026-10-28T00:00:00ZCollected: 2026-10-30T03:02:34Z | Yahoo Finance chart | Stale |
| EthereumETH | 2357.6240234375Previous: 2347.72998046875 | +0.42% | 2026-10-282026-10-28T00:00:00Z → 2026-10-29T00:00:00ZWindow: utc_calendar_day_24hProvider time: 2026-10-28T00:00:00ZCollected: 2026-10-30T03:02:34Z | Yahoo Finance chart | Stale |
Sources and method
Stocks use their latest complete sessions; crypto assets have explicit measurement windows. Dates are listed in the table. Interpretations are separated from observed facts and can be checked against the original sources below. Read the measurement policy.
For information only, not investment advice. Read all daily observations