Two US Stock Indices Rise; Latest Shanghai Composite Observation Remains September 30
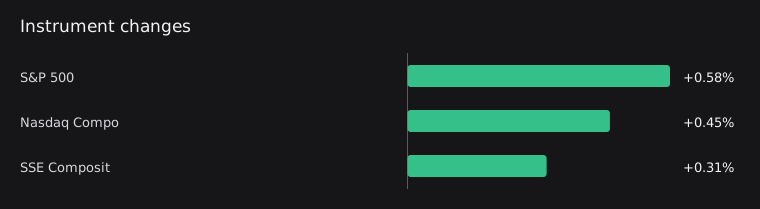
On October 6, the S&P 500 rose 0.58% and the Nasdaq Composite gained 0.45%. The latest available full trading session for the Shanghai Composite was September 30, when it rose 0.31%. These records cover different trading dates, and Hong Kong equity and cryptocurrency data are insufficient to determine whether markets moved in sync.

Two US Stock Indices Rise Together
For the full trading session on October 6, the S&P 500 rose 0.58% from its October 5 close, while the Nasdaq Composite gained 0.45%. Both indices closed higher, with the S&P 500 posting a slightly larger gain. These two indices alone do not establish how individual sectors contributed.
Shanghai Composite and US Records Cover Different Dates
The latest available full trading session for the Shanghai Composite was September 30, when it rose 0.31% from its September 29 close. This observation and the US gains on October 6 cover different trading dates, so they do not establish that the two markets strengthened in sync.
Sources: [3]
Telecom Use of Open Models Features in an Official Announcement
The summary of an official NVIDIA announcement says telecom operators are increasingly building their AI strategies around open models, with considerations including control over and customization of critical workloads. Applications include autonomous networks and customer service. The summary supports this industry observation but is insufficient to explain the US index gains covered in this edition.
Sources: [4]
Related news and discussion
Why Telecom Operators Are Building Their AI Strategy on Open Models
The summary of an official NVIDIA announcement says telecom operators' reasons for adopting open models extend beyond cost to include the ability to control and customize AI, for workloads such as autonomous networks and customer service.
What to watch next
- Whether the S&P 500 and Nasdaq Composite continue moving in the same direction in the next full trading session, and whether their ranking by percentage gain changes.
- The date and direction of change in the next complete closing record for the Shanghai Composite, and whether it allows a comparison closer to the US observation date.
- Once valid records are available for the CSI 300, Hang Seng Index, Hang Seng TECH Index, Bitcoin and Ethereum, each market's clearly defined comparison window and direction of change.
Market data
| Instrument | Price | Change | Session / window end | Source | Quality |
|---|---|---|---|---|---|
| S&P 500^GSPC | 7,818.9302 | +0.58% | 2026-10-06 | Yahoo Finance chart | Available |
| Nasdaq Composite^IXIC | 27,599.8867 | +0.45% | 2026-10-06 | Yahoo Finance chart | Available |
| SSE Composite000001.SS | 3,842.1951 | +0.31% | 2026-09-30 | Yahoo Finance chart | Available |
| CSI 300000300.SS | — | — | Not provided | Yahoo Finance chart | No reliable data |
| Hang Seng Index^HSI | — | — | Not provided | Yahoo Finance chart | No reliable data |
| Hang Seng Tech Index^HSTECH | — | — | Not provided | Yahoo Finance chart | No reliable data |
| BitcoinBTC | — | — | Not provided | CoinGecko market chart | No reliable data |
| EthereumETH | — | — | Not provided | CoinGecko market chart | No reliable data |
Sources and method
Stocks use their latest complete sessions; crypto assets have explicit measurement windows. Dates are listed in the table. Interpretations are separated from observed facts and can be checked against the original sources below. Read the measurement policy.
For information only, not investment advice. Read all daily observations